
6 Important Factors to Consider When Reviewing Clinical Data on New Weight Loss Molecules
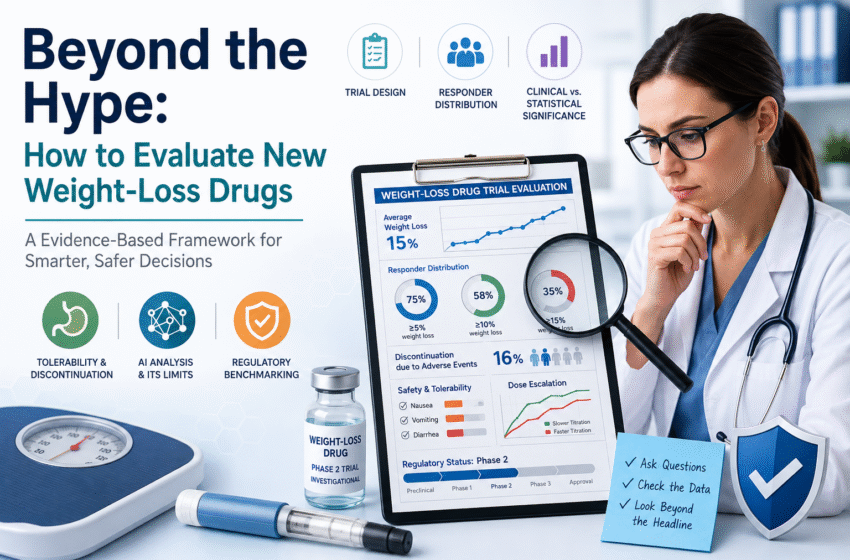
Every so often, the popular media turns to this subject and reports that a new weight-loss molecule – defined by that all-important metric of “percentage of body weight loss,” usually at its highest dose, under maximum therapeutic conditions and often at the final time point of the shorter phase 2 trials, 52 weeks – has emerged. That number is often quoted out of context, above all the unanswered (but in many cases also unmentioned) questions regarding the true clinical efficacy, safety, and tolerability of the compound at the usual phase 3 dose recommended for marketing if phase 3 trials have not yet been completed.
Table of Contents
Trial design: the foundation that determines everything else
Before you believe any single number purporting to show a drug’s effectiveness, read the entire trial. Look at who funded it. Be more critical of data from industry-funded studies. If the active comparator is an older patented drug (orlistat, phentermine/topiramate), look hard at the dosing schedule. If the comparison drug is generic (phentermine monotherapy, topiramate alone), note price discrepancies. If the trial is conducting post-hoc analyses, be alert to possible spin. Look out for unmatched visit frequency between arms, different follow-up lengths, or using last observation carry-forward.
Also remember that drug trials lean heavily on the intention-to-treat population, in which any missing or noncompliant patient is counted as treatment failure. Finally, push back against enthusiasm in any authors’ discussion or press release. These may be written by someone with a financial conflict of interest.
Responder distributions matter more than mean outcomes
The most important number is the average amount of weight lost, but it is also the easiest one to misinterpret. For example, an average weight loss of 15% among 300 people could mean that everyone lost 15% of their weight, or it could mean that 50 people lost 40% while the others lost 6%. Those scenarios differ dramatically in their clinical implications.
The most revealing data point is the responder distribution: the percent of people who lost at least 5% of their weight, at least 10%, and at least 15%. 5% is an important threshold because it’s right around this level that metabolic improvements become consistently apparent. 10% and 15% are important thresholds because the weight loss tends to be more durable, and the cardiometabolic benefits appear to be greater.
If the responder distribution is not in the abstract or main paper, look in the supplementary data, where this information often gets buried.
Separate statistical significance from clinical significance
If the p-value indicates that the result is unlikely to be due to chance, it is statistically significant. But a p-value doesn’t indicate whether the result could make a difference to a patient. For that, you need to look at the confidence intervals around the estimated effect size. The confidence intervals give you the range of values within which the true (population) value is likely to lie.
If the confidence intervals include effect sizes that are clinically unimportant, even if they do not cross zero (indicating a lack of statistical significance), it may not be a meaningful result. Similarly, if the confidence intervals are very wide, it suggests that the estimate is imprecise and more data would be needed to make a solid conclusion.
Read the tolerability data more carefully than the efficacy data
Nausea, vomiting, and diarrhea are the most common adverse events associated with gastrointestinal problems caused by all incretin-based weight-loss drugs. This is a major factor. It is the most important predictor of whether a drug will be effective for use in real-world practice, rather than in trial conditions.
You have to look at the number of patients who stopped taking the drug as a result of adverse events first. If it is around 15-20% due to gastrointestinal adverse events, for example, you know that nearly one in six or seven patients will quit the treatment before reaching the weight-loss result in the trial. This considerably changes the interpretation of the average outcome. Those patients who have continued on the drug long enough to contribute to the efficacy data are not a real representation of all those who are taking the drug.
The dose escalation is relevant too. You will notice, if you compare the studies, that those with a slower increase in dose, over a couple of months rather than weeks, had lower discontinuation rates, but the weight loss started to take effect later. Therefore, when you compare tolerability data across molecules, make sure they used comparable titration and dose-escalation schedules. If it looks like one molecule is better-tolerated, it may be just that it has a slower dose increase built into the program.
The role of AI in trial analysis – and its limits
Artificial intelligence influences how obesity trial data is analyzed and used. Before the start of the trials, machine-learning is used to build models for patient stratification. Additionally, responder subgroups within trial data are identified, and adverse event signal detection helps identify safety reports that appear unusual compared with the statistical surveillance model.
This requires a little unpacking to understand why this matters. If a trial report includes results based on AI-derived predictions of response rate within a certain demographic, those results carry additional caveats you may want to consider. The machine-learning model that generates these predictions can only be as good as the training data, and that data is the trial population – which, since we’re talking about hypothetical patients still years away from possibly using this new medicine, may vary fairly widely from the demographics of the actual patients who would be prescribed the treatment if and when it’s approved.
The old computer science adage garbage in / garbage out is still in full effect. A model trained on a trial population that under-enrolls certain age, racial, or educational groups will produce predictions that look precise but actually have very broad confidence intervals because they’re being projected from a poorly representative population. The sophistication of the machine learning algorithm isn’t making up for the fact that it’s being fed biased data. When you first leaf through a paper on a recent Phase II study of an exciting new anti-obesity medication and come to a table with a header like “Machine-Learning-Derived Predictors of Response,” your first thought should be “What was the training population?”
Benchmark against established agents, then assess regulatory position
The context makes a difference. What context? For starters, what “data” is present is just one part of the information pool. In obesity, the Phase 2 data in question here may be an unusually robust dataset but a single Phase 2 dataset is still just that; one dataset. In isolation, it can be intriguing, convincing, even compelling. Realistically, that’s not enough to make a drug a treatment option.
With a comparison in hand, how a single Phase 2 dataset fits against the comparator data provides more full-scale evaluation: exactly how new or different is this treatment? The Phase 2 retatrutide data suggested it could be quite good at helping some people with obesity lose weight – perhaps a step forward compared to what’s available now. How far forward, and for how many people, is what the context of comparators and public health need will begin to answer.
But comparator data isn’t the context that gets the compound into clinics – at least not yet. How far off the market is Phase 3 completion? What’s the scientific, ethical, and patient-safety rationale for advancing this compound to a broader, likely longer-term treatment population? Sort through those details and you’ll reach an informed position.
Regulatory context is step three. A molecule that’s not in Phase 3 cannot reach patients. It can be the best molecule in the history of drug discovery but until there’s a regulatory submission to evaluate, it is not ready for clinical use. For those following the development of emerging molecules in Canada, retatrutide Canada supplies are available through research peptide providers, but the same evaluative scrutiny this article outlines applies directly to sourcing decisions. Standardized formulations, more reliable purity standards, and tightly regulated distribution save lives and limit suffering every day; making sure your supply chain includes them is the first step.
Intention-to-treat analysis versus per-protocol: a final check
Another aspect of bias that we must consider is industry bias. Pharmaceutical companies have numerous levers to influence how their data are reported, analyzed, and discussed publicly. They control the analysis and drafting of papers arising from their sponsored clinical trials, choose what to publish, when to publish it, and where to submit the work. They grant authorship to influential researchers who did not participate in writing the paper, and they pay professional authors to ghostwrite papers, reports, guidelines, and reviews. They decide when and how data are shared, provide slides and posters for medical congresses, shape what physicians hear at educational events, fund professional organizations and patient advocacy groups, and determine how potential conflicts of interest are disclosed.
Applying the framework
These six factors help us ask the right questions when results are released: trial design integrity, responder distribution, statistical versus clinical significance, tolerability and discontinuation data, the AI analysis layer, and regulatory benchmarking. A new agent can tick all these boxes and still not work for your patients. Conversely, thinking through this framework has led me to have a lot more time for the agents I used to dismiss, because the value when you dig beneath the headline can be greater than you think.